Analytics
What this section does
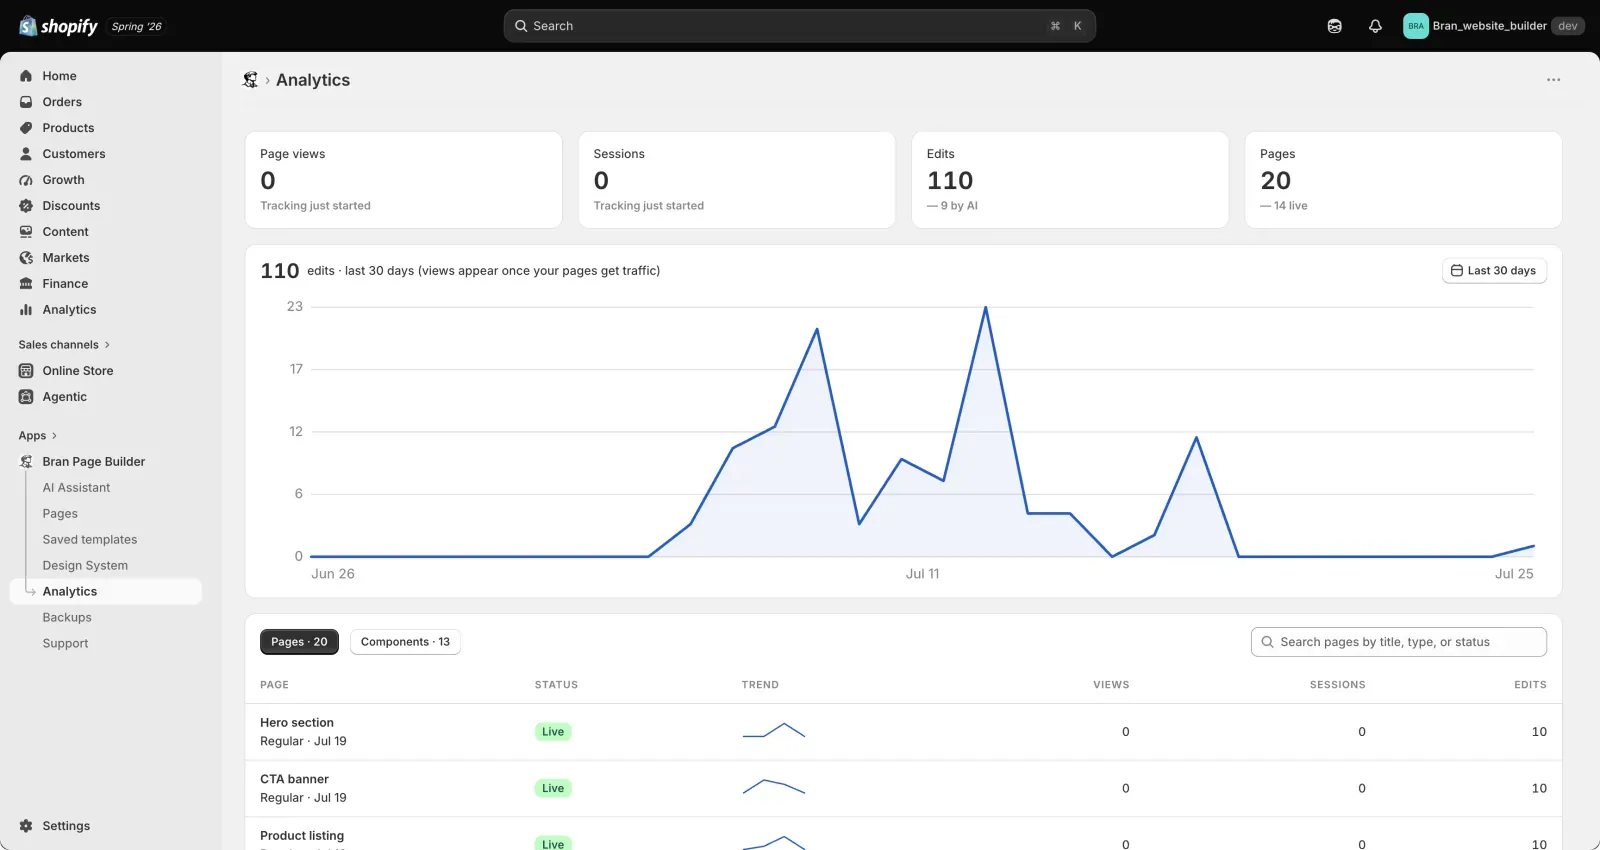
Section titled “What this section does”Analytics reports how your published Bran pages are performing and how much editing activity they are getting. It covers views, sessions, edits, and which components you use most.
The key numbers
Section titled “The key numbers”| Metric | What it means |
|---|---|
| Page views | How many times your published Bran pages were loaded by visitors in the selected period |
| Sessions | How many separate visits those views came from |
| Edits | How many times pages were edited in the period, with the share made by a connected AI assistant |
| Pages | How many Bran pages you have, and how many are live |
Views and sessions are compared against the previous period of the same length, so you can see whether traffic is rising or falling.
Choosing a period
Section titled “Choosing a period”Use the date control above the activity chart to switch between preset periods, all time, or a custom date range. Every figure on the page follows the period you choose.
The page table
Section titled “The page table”Each published page is listed with its status, a trend sparkline, and its views, sessions, and edits for the period. Sort by any column to find your best and worst performers, or search to narrow the list.
The component table
Section titled “The component table”The component view shows which components you use, on how many pages, and how many views and edits they account for. It is useful for deciding which layouts are worth investing in and which ones you have stopped using.
When tracking starts
Section titled “When tracking starts”View tracking begins as soon as a page is published and receives real traffic. Until then, the app shows editing activity instead and tells you that views will appear once your pages get traffic.
Note: If your store is password-protected, most visitors never reach your pages, so views stay low or empty until the store is open to the public.
How view tracking works
Section titled “How view tracking works”Views are recorded by a lightweight signal sent when one of your published Bran pages renders. It records that a page was viewed and groups views from the same visit into a session, using a random identifier that lasts only for that browsing session.
No cookies are used, no personal data about the shopper is collected, and views cannot be tied back to an individual. See the Privacy Policy for details.
Data retention
Section titled “Data retention”Raw view records are kept for 90 days. Reporting periods longer than that reflect the data available.
- Compare pages, not days. A single day’s traffic is noisy; the page table over 30 days tells you far more.
- Watch sessions alongside views. Many views from few sessions usually means people are reloading or navigating back, not that more people are arriving.
- Use the component table before you build another page. Reuse the layouts that are already earning views.
Does Analytics show sales or conversions?
Section titled “Does Analytics show sales or conversions?”No. Bran reports views, sessions, and editing activity for your pages. For sales and conversion reporting, use Shopify’s own analytics.
Why do the numbers differ from Shopify Analytics?
Section titled “Why do the numbers differ from Shopify Analytics?”They measure different things. Bran counts renders of your Bran page content; Shopify counts store-wide sessions with its own definitions and filtering. Some difference is normal.
Do views from my own visits count?
Section titled “Do views from my own visits count?”Yes, a page you open on your storefront is counted like any other view. Use a period long enough that your own testing does not skew the picture.
Why is a page missing from the table?
Section titled “Why is a page missing from the table?”Only published pages can collect views. Drafts appear once they have been published.
Related guides
Section titled “Related guides”Need help?
Section titled “Need help?”If you still need help, contact support via the Contact page.